Up to date
This page is up to date for Redot 4.3.
If you still find outdated information, please create an issue.
Using C++ profilers
To optimize Redot's performance, you need to know what to optimize first. To this end, profilers are useful tools.
Note
There is a built-in GDScript profiler in the editor, but using C++ profiler may be useful in cases where the GDScript profiler is not accurate enough or is missing information due to bugs in the profiler.
Recommended profilers
VerySleepy (Windows only)
HotSpot (Linux only)
Xcode Instruments (macOS only)
These profilers may not be the most powerful or flexible options, but their standalone operation and limited feature set tends to make them easier to use.
Setting up Redot
To get useful profiling information, it is absolutely required to use a Redot build that includes debugging symbols. Official binaries do not include debugging symbols, since these would make the download size significantly larger.
To get profiling data that best matches the production environment (but with debugging symbols),
you should compile binaries with the production=yes debug_symbols=yes SCons options.
It is possible to run a profiler on less optimized builds (e.g. target=template_debug without LTO),
but results will naturally be less representative of real world conditions.
Warning
Do not strip debugging symbols on the binaries using the strip command
after compiling the binaries. Otherwise, you will no longer get useful
profiling information when running a profiler.
Benchmarking startup/shutdown times
If you're looking into optimizing Redot's startup/shutdown performance,
you can tell the profiler to use the --quit command line option on the Redot binary.
This will exit Redot just after it finished starting.
The --quit option works with --editor, --project-manager or
--path <path to project directory> (which runs a project directly).
See also
See Command line tutorial for more command line arguments supported by Redot.
Profiler-specific instructions
VerySleepy
Start the Redot editor or your project first. If you start the Project Manager, make sure to edit or run a project first. Otherwise, the profiler will not track the child process since the Project Manager will spawn a child process for every project edited or run.
Open VerySleepy and select the Redot executable in the list of processes on the left:
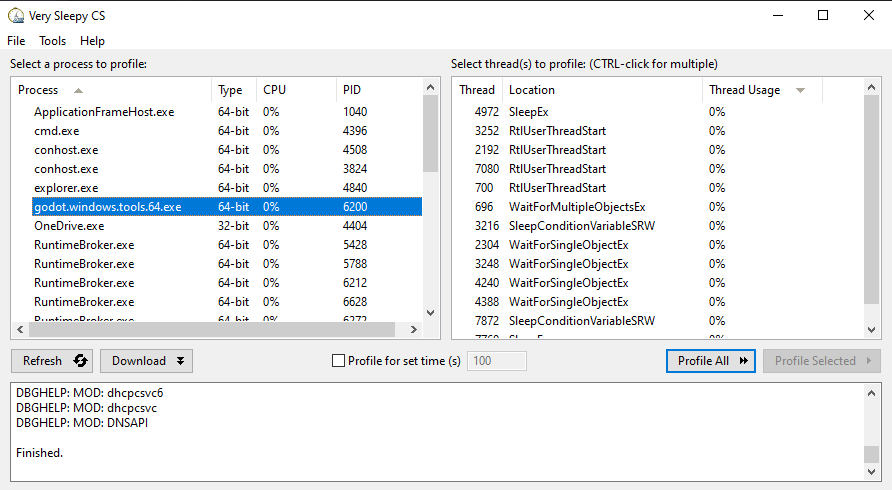
Click the Profile All button on the right to start profiling.
Perform the actions you wish to profile in the editor or project. When you're done, click Stop (not Abort).
Wait for the results window to appear.
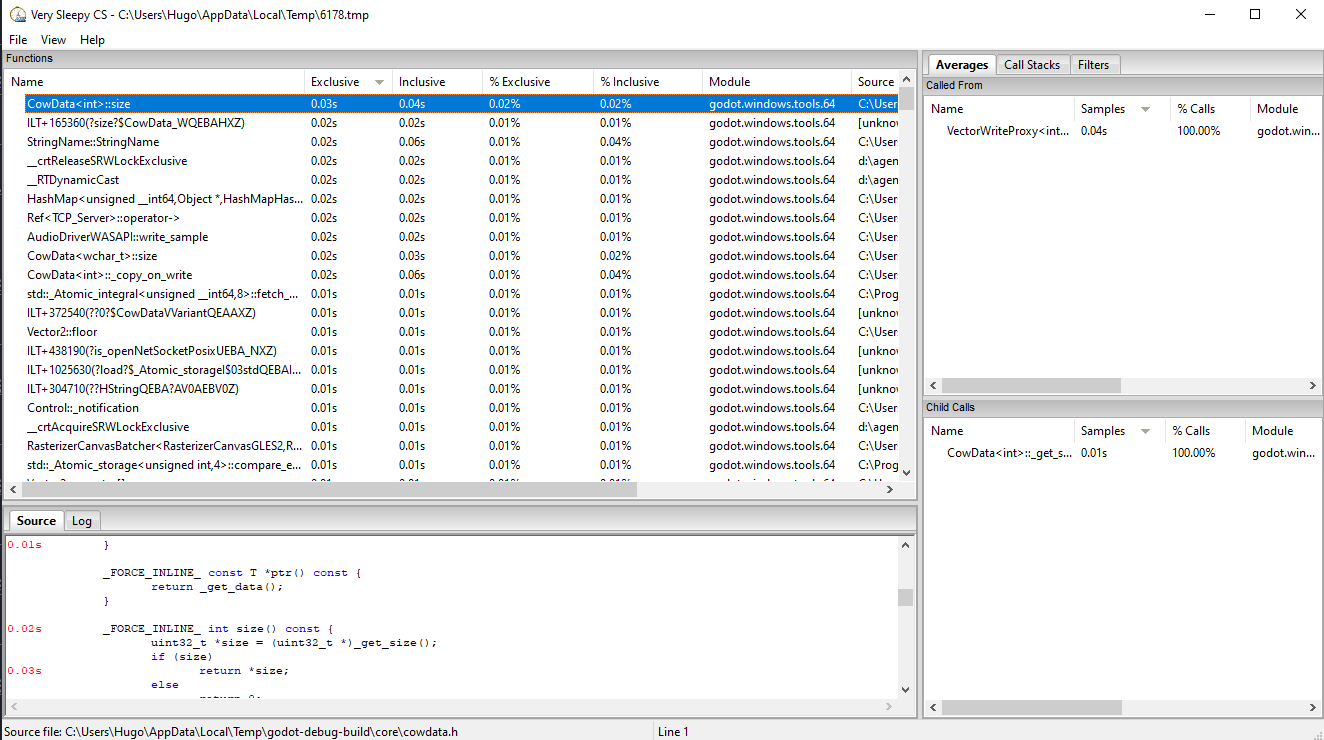
Once the results window appears, filter the view to remove external modules (such as the graphics driver). You can filter by module by finding a line whose Module matches the Redot executable name, right-clicking that line then choosing Filter Module to <Redot executable name> in the dropdown that appears.
Your results window should now look something like this:
HotSpot
Open HotSpot. Click Record Data:

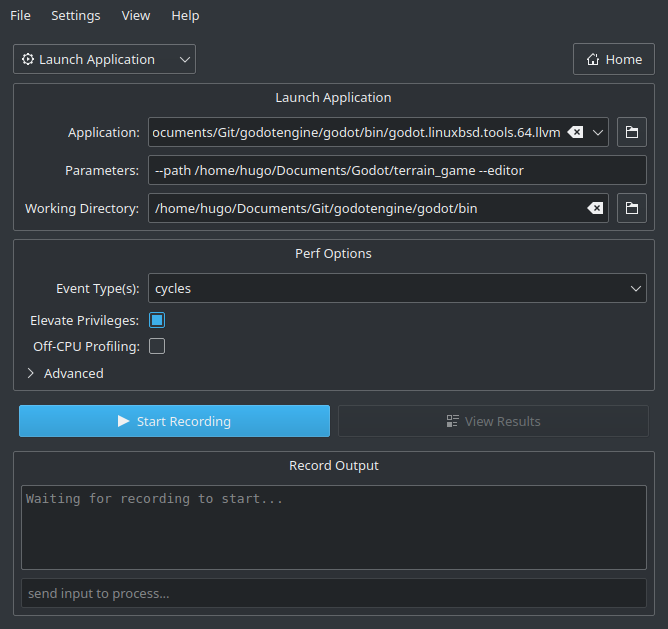
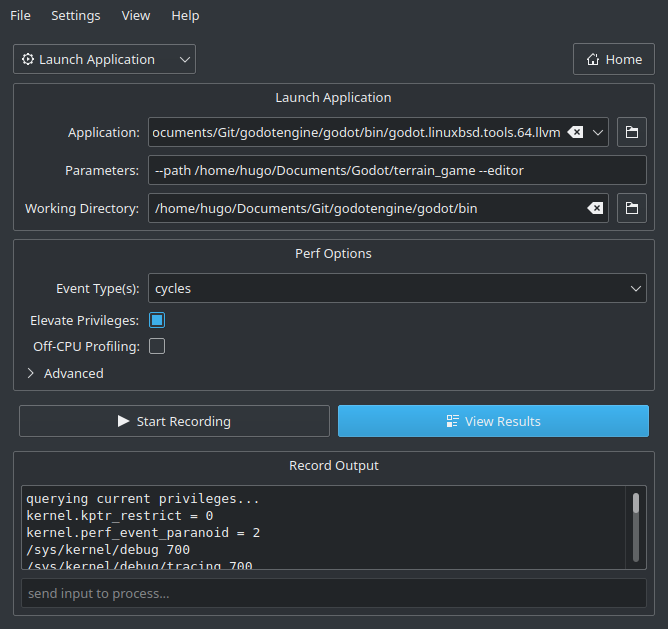
In the next window, specify the path to the Redot binary that includes debug symbols.
Specify command line arguments to run a specific project, with or without the editor.
The path to the working directory can be anything if an absolute path is used for the
--pathcommand line argument. Otherwise, it must be set to that the relative path to the project is valid.Make sure Elevate Privileges is checked if you have administrative privileges. While not essential for profiling Redot, this will ensure all events can be captured. Otherwise, some events may be missing in the capture. Your settings should now look something like this:
Click Start Recording and perform the actions you wish to profile in the editor/project.
Quit the editor/project normally or use the Stop Profiling button in HotSpot to stop profiling early. Stopping profiling early can result in cleaner profiles if you're not interested in the engine's quit procedure.
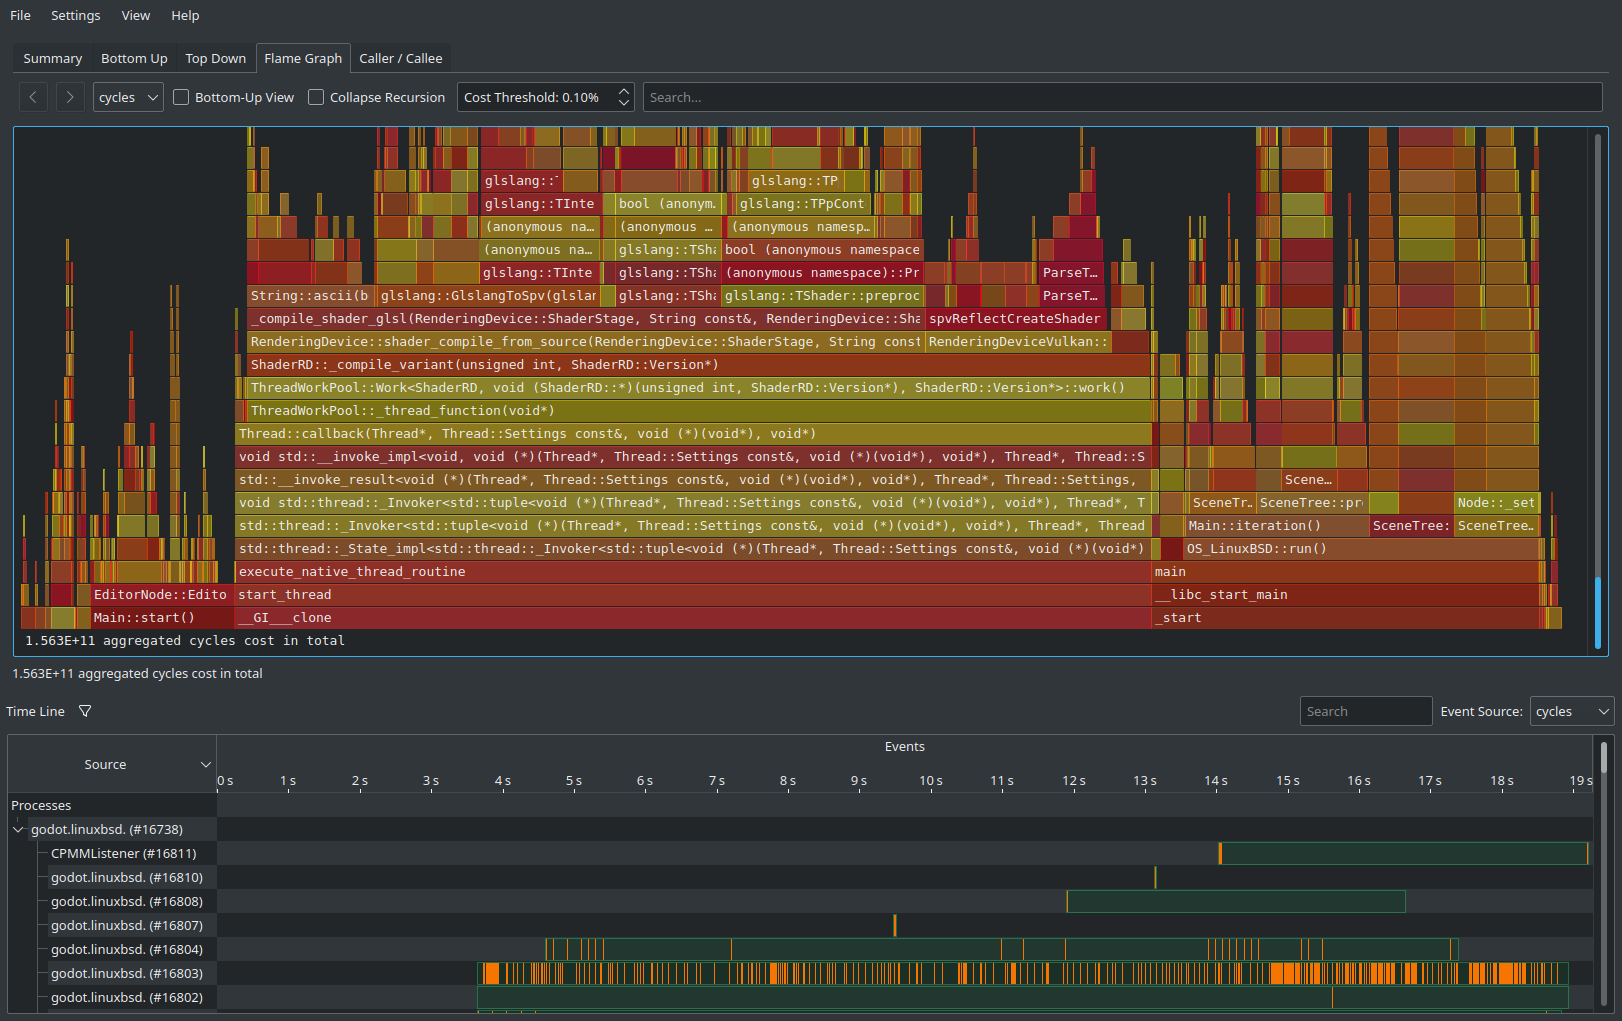
Click View Results and wait for the profiling visualization to be generated:
Use the tabs at the top to navigate between the different views. These views show the same data, but in different ways. The Flame Graph tab is a good way to see which functions take up the most time at a glance. These functions are therefore the most important ones to optimize, since optimizing them will improve performance the most.
At the bottom of all tabs except Summary, you will also see a list of CPU threads started by the engine among with the CPU utilization for each thread. This lets you see threads that can be a bottleneck at a given point in time.
Note
If you don't want the startup procedure to be included in the profile, you can also attach HotSpot to a running process by clicking Record Data then setting the Launch Application dropdown option to Attach To Process(es).
This process attachment-based workflow is similar to the one used by VerySleepy.
Xcode Instruments
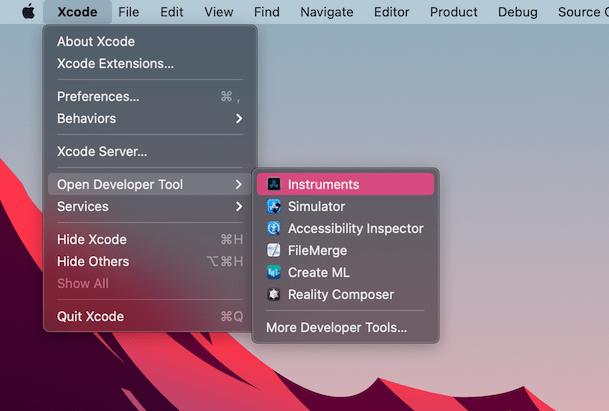
Open Xcode. Select Open Developer Tool - Instruments from the Xcode app menu:
Double-click on Time Profiler in the Instruments window:
In the Time Profiler window, click on the Target menu, select Choose target... and specify the path to the Redot binary, command line arguments and environment variables in the next window.
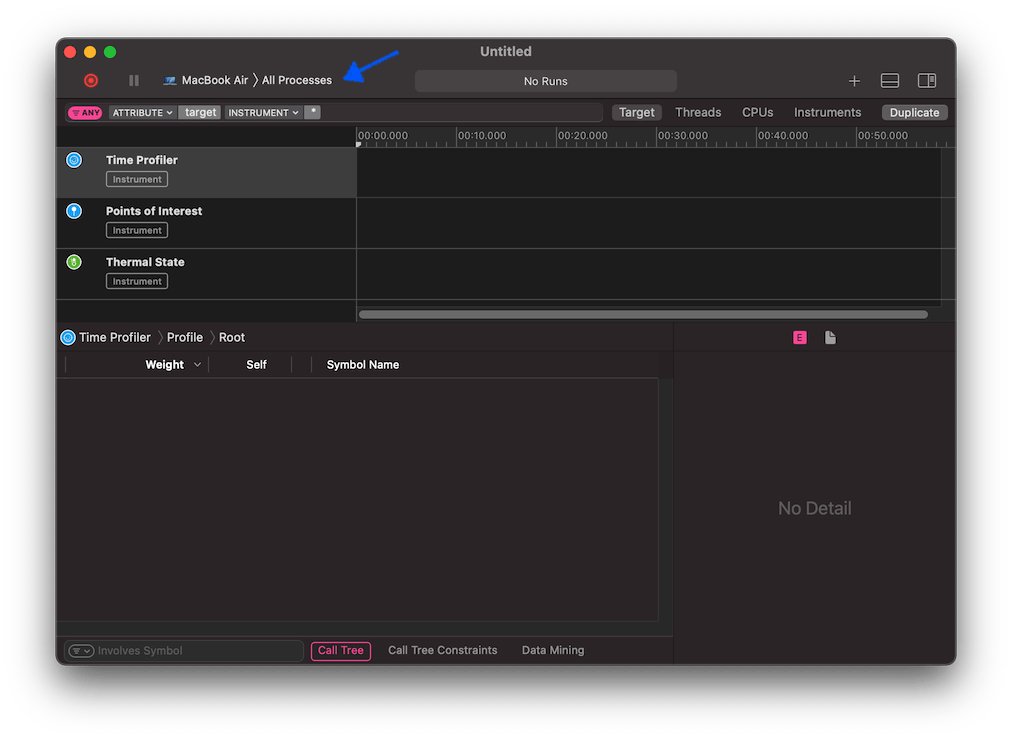
You can also attach the Time Profiler to a running process by selecting it from the Target menu.
Click the Start an immediate mode recording button to start profiling.

Perform the actions you wish to profile in the editor or project. When you're done, click the Stop button.
Wait for the results to appear.
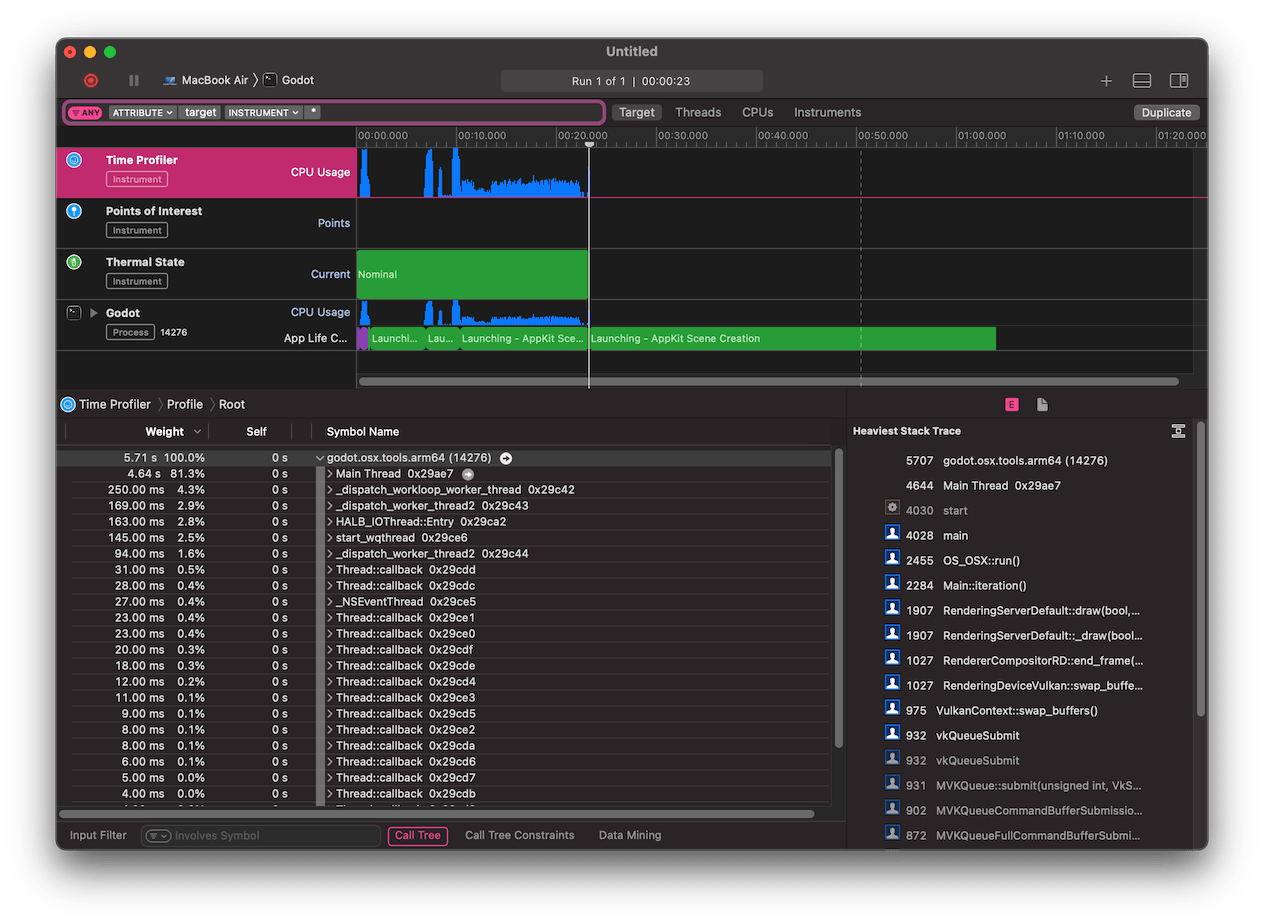
At the bottom of the window you will see a call tree for all CPU threads started, and the Heaviest Stack Trace overview.
Select Hide system libraries in the Call Tree menu (at the bottom of window) to remove external modules.
You can use the timeline at the top of the window to display details for the specific time period.
