Attention: Here be dragons (unstable version)
This is the latest
(unstable) version of this documentation, which may document features
not available in or compatible with released stable versions of Redot.
Checking the stable version of the documentation...
Script Editor
Introduction
Redot Engine's script editor is a powerful and fully-integrated text editor that not only streamlines the process of writing and debugging code written in GDScript but also allows for working with plain text files, providing developers with a seamless environment for scripting game logic and behaviors. It can highlight your code, automatically indent it, perform syntax checks, and much more. You can also create breakpoints to debug your project without switching to another window. The text editor also serves as an offline class reference viewer, which can be accessed in several ways as described in the Integrated class reference.
Features
Some of the key features of the text editor are listed below:
Fully-integrated code editor for GDScript.
Syntax highlighting support for GDScript and JSON files.
Syntax checking for GDScript and JSON files.
Bookmark and breakpoint support.
Automatic indentation.
Code folding.
Customizable theme.
Multiple carets, which can be enabled using Alt + Left Click.
Auto-completion of variables, functions, constants, etc.
Inline refactoring of symbols by selecting them and using Ctrl + D.
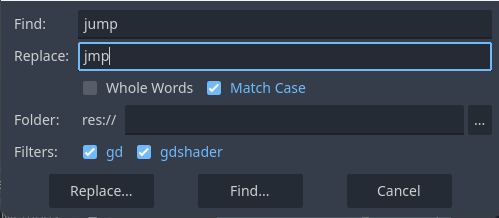
Mass find and replace across project files.
Usage
If you are using GDScript in your project, the built-in text editor in Redot provides everything you need, serving as a one-stop location to fully utilize the Redot Engine. Nearly all parameters that can be adjusted via the user interface can also be modified directly through code.
Note
If you would like to use an external text editor or prefer to use C# in your project, see Using an external text editor and Configuring an external editor.
Tip
Similar to many parts of the Redot's interface, the text editor can also be customized by changing its settings to your liking. You can access these settings by opening Editor > Editor Settings and going to the Text Editor group.
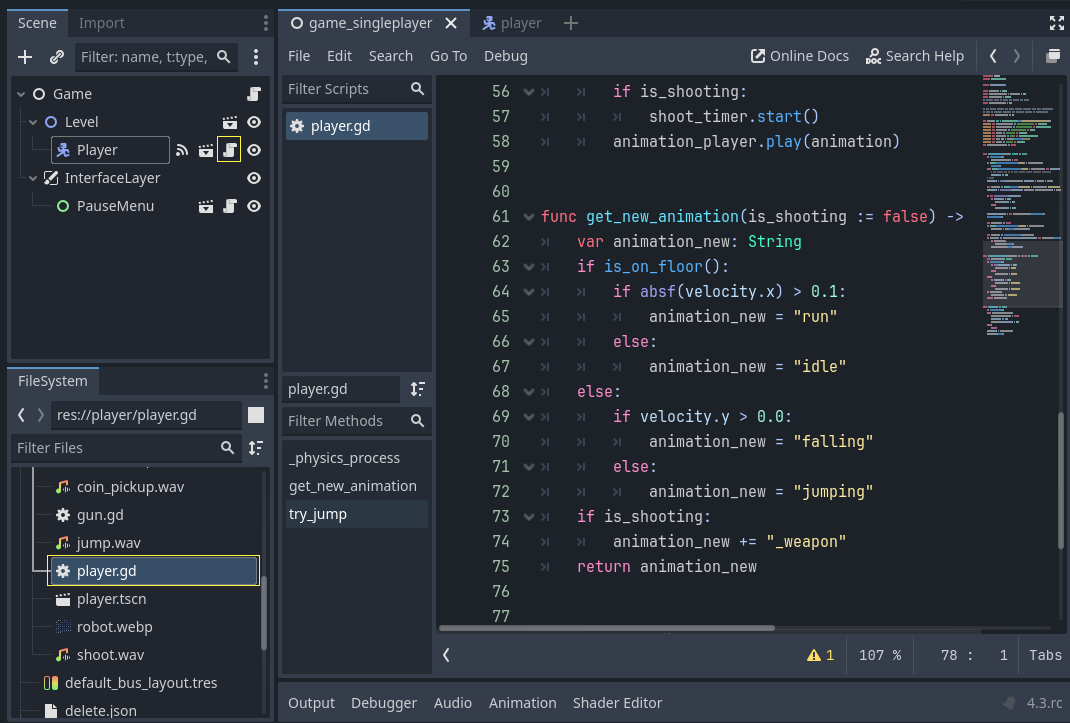
You can open the Script Editor using the Script button in the workspace selector,
located at the top center of Redot's interface.
Alternatively, you can use the Open Script button next to a node in the
Scene Tree dock, or double-click on a .gd file or a recognized text file in
the FileSystem dock to open it directly in the Script Editor.

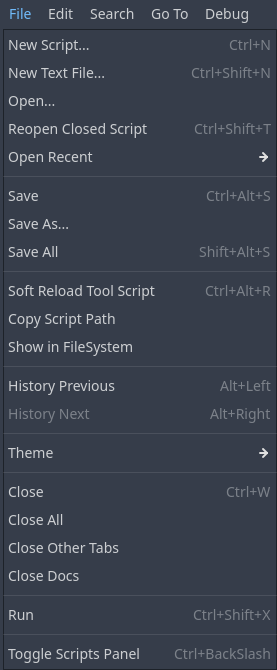
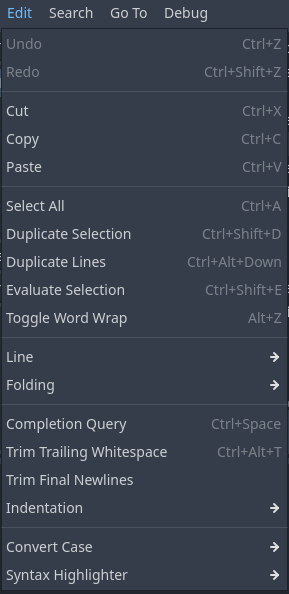
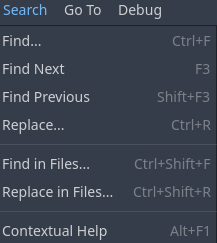
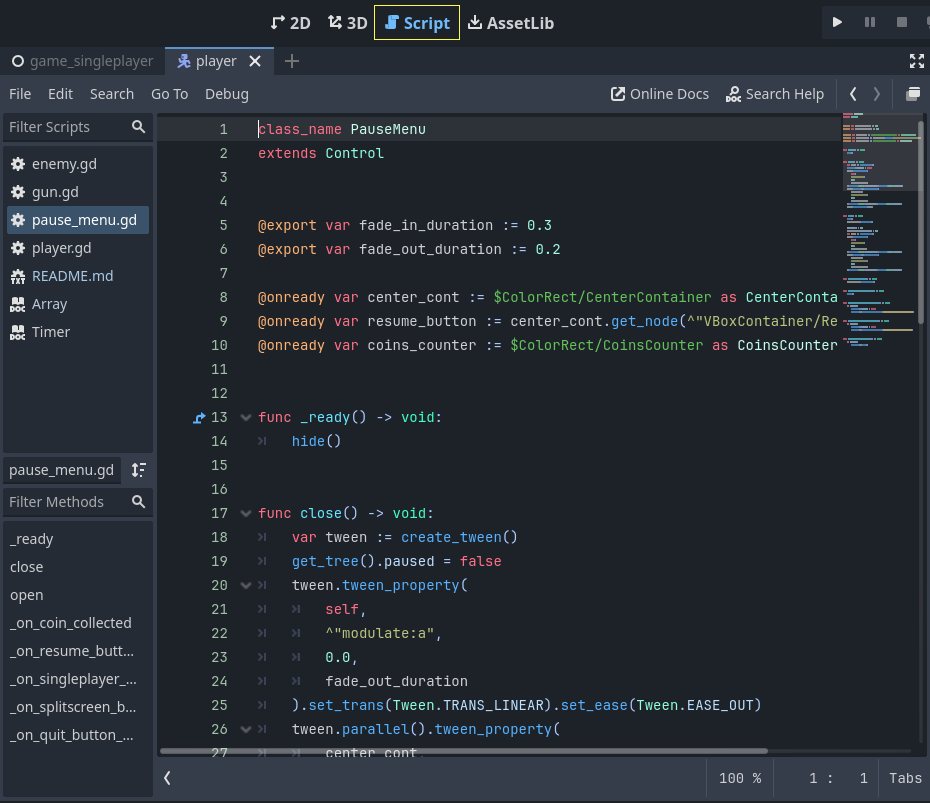
Once it is open, you will see the text editor menus at the top, below the scene switcher. Next to the menus, you'll find buttons to open the online documentation or search within the built-in class reference. To the right of these buttons are two navigation arrows that allow you to navigate through your viewing history. Finally, you can use the float button to separate the text editor from Redot's window, which is useful if you are working with multiple monitors.
Underneath the menus on the left, you will see the script panel. In the center,
adjacent to the script panel, is the coding area. Beneath the coding area is the
status bar, which displays the error and warning count in the code.
Clicking on the error or warning icons will show the list of errors with
the line numbers. Clicking on one will jump to that line.
You can also choose to ignore warnings by opening the list and
clicking Ignore.
The status bar also lets you change the zoom level of the code by clicking
the percentage value. You can also use Ctrl + Mouse Wheel
(Cmd + Mouse Wheel on Mac) to achieve the same effect.
The status bar also shows the current position of the caret in terms of line and
column, and whether the indentation is done using tabs, or spaces.
Many of the actions performed in the text editor can also be executed using shortcuts. The actions show their corresponding shortcuts next to them. For a complete shortcut list, see the text editor shortcuts.
In the next sections, we will go through different aspects of the text editor. You can also select a section below to jump to a specific topic:
Script Panel

Below the menus, on the left panel, you will see a list of opened files and documentation
pages. Depending on the file type, this list will have an icon next
to the file name. For example, the  icon means that it is a GDScript.
the
  means it is a C# script. The
  means that this is a
built-in class reference. Finally, the
  means it is a currently running
script (See tool annotation for more on this).
Hovering a file will show a tooltip with its relative location in the project folder.
On the status bar, clicking the left arrow hides the script panel, clicking on the right arrow shows it.
If you did not change any settings, the file names may also have a different coloring. This helps you identify the recently edited files by highlighting them. This behavior can be changed in the Editor > Editor Settings by adjusting the Script Temperature properties in the Text Editor section.
The filter bar above the file names introduces a handy case-insensitive search to
find a specific file. Even if you just type the letters of a file name into the
bar, files containing these letters in order will also appear. Assume that there
is a file named button.gd in the list. If you type btn into the filter bar,
this file will appear in the results. To reset the filter, clear the filter bar.
An asterisk (*) next to a file name indicates that the file has unsaved changes.
Tip
If you just enter "*" in the filter bar, you can display all unsaved files.
You can drag a file to change the ordering. Middle-clicking on a file closes it. Right-clicking on a file provides several options to save or close files, or to copy the relative path of the file. On this menu:
You can also use Move Up and Move Down to change the order of the file, or use Sort to sort all files alphabetically. Toggle Scripts Panel hides the panel, which can be displayed again using the right arrow on the status bar. Close Docs closes all opened in-class reference documents leaving only script files open. Show in FileSystem finds and highlights the file in the FileSystem dock.
Below the file list, you'll see the name of the currently open file. The button next to this switches the ordering of the methods defined in this file between alphabetical and as they appear. Under this is the outline of the file. If this is a script file, it will contain the list of defined methods. If, however, a class reference page is open, this area will show the table of contents of this document. Clicking on an item in this list will jump to the respective function or section in the file. Similarly, the Filter Methods bar lets you search for a specific function or section within the selected document with the same behavior as filtering scripts.
Coding area
Note
This section will only cover the basics of the coding area in terms of the user interface. To learn more about scripting in Redot, refer to the GDScript reference or Scripting documentation.
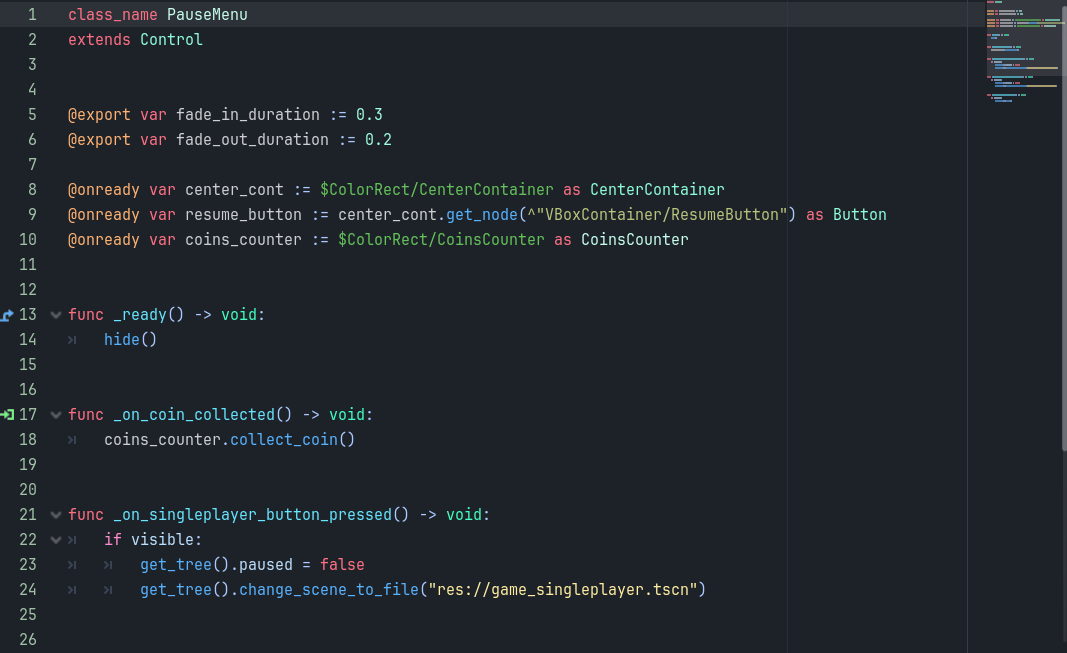
The coding area is where you will type your scripts if you are using the built-in text editor. It offers highlighting and auto-completion features to help you while you code.
The coding area shows line numbers on the left side. Below the navigation arrows on the right side, there is a clickable minimap that provides an overview of the entire script, allowing you to scroll through it.
If a line of code is long enough (more than 80 characters, by default), the text editor will display a vertical line that can be used as a soft guideline. For a hard guideline, this value is set to 100 characters, by default. Both values can be changed, or the display of the line can be toggled in the "Appearance" settings of the text editor.
In the script, to the left of function definitions, you might see additional icons. The  icon indicates that this function is an override of an existing
function. Clicking it opens the documentation of the original function. The
  icon means
that it is a receiving method of a signal. Clicking it shows where the signal is coming
from. A
  icon to the left of the line denotes a foldable block. You can
click to collapse or expand it.
Alternatively, the ellipsis (...) icon can also be clicked to expand a folded block.
The example below summarizes the paragraph above. Lines 52, 56, and 58 are foldable blocks, line 57 is a code region with the name "New Code Region," which you can also fold, and line 62 is a folded block. Line 53 is a bookmark, which can quickly be jumped to using the Go To > Bookmarks menu. Line 55 is a breakpoint that can be used in debugging.
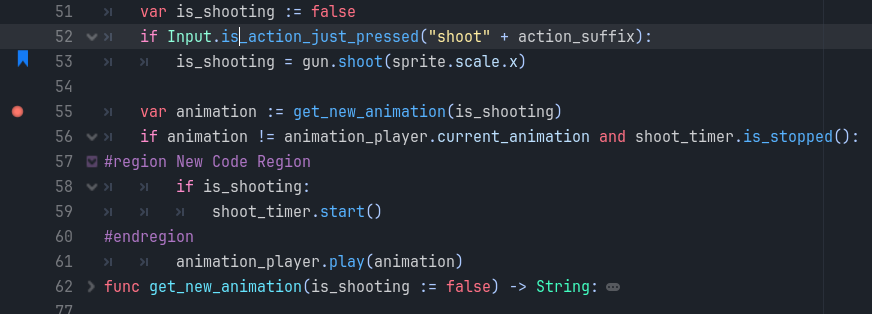
Many of the colors of the text editor such as highlighting colors, or even breakpoint or bookmark icon colors can be customized. You can experiment them by opening the text editor settings navigating to Editor > Editor Settings > Text Editor section.

